

Interactive 3D visualization for wireless sensor networks
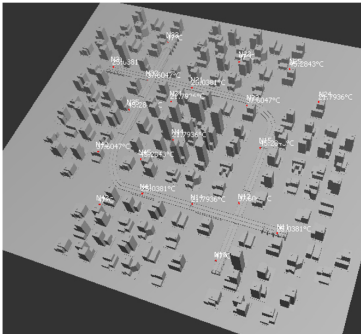
Wireless sensor networks open up a new realm of ubiquitous computing applications based on distributed large-scale data collection by embedded sensor nodes that are wirelessly connected and seamlessly integrated within the environment. 3D visualization of sensory data is a challenging issue, however, due to the large number of sensors used in typical deployments, continuous data streams, and constantly varying network topology. This paper describes a practical approach for interactive 3D visualization of wireless sensor network data. A regular 3D grid is reconstructed using scattered sensor data points and used to generate view-dependent 2D slices that are consequently rendered with commodity graphics hardware leading to smooth visualization over space and time. Furthermore, the use of efficient space partitioning data structures and the independent processing of sensor data points facilitates interactive rendering for large number of sensors while accommodating constantly changing network topology. The practical value of the proposed method is demonstrated and results obtained for visualizing time-varying temperature distributions in an urban area are presented. © Springer-Verlag 2010.